The Performance Monitor introduced in Windows is a good built-in tool that lets you monitor and study how applications you run, affect your computer’s performance, both in real-time and by collecting log data for later analysis. In this post, we will see how to use Performance Monitor or Perfmon, as it is called, in Windows 11/10.
How to open Performance Monitor in Windows 11/10?
You can open Performance Monitor in Windows, by following any one of the following methods:
- Press Win+F, type perfmon in the Search bar and hit Enter
- Press Win+R, type perfmon in the Run box and hit Enter
- Open Command Prompt or PowerShell, type perfmon.exe and hit Enter
- Open System Configuration Tool > Tools tab > Select the Performance Monitor > Click Launch button
- Open Computer Management > On left select Performance > Expand Monitoring Tools > Click on Performance Monitor.
How to use Performance Monitor in Windows 11/10
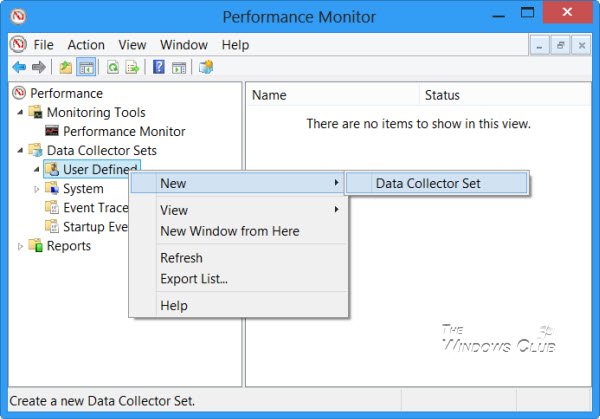
Open the WinX menu in Windows 11/10 and select Run. Type perfmon.exe and hit Enter to open the Performance Monitor. In the left pane, select the User Defined node, right-click on it and select New > Data Collector Set.
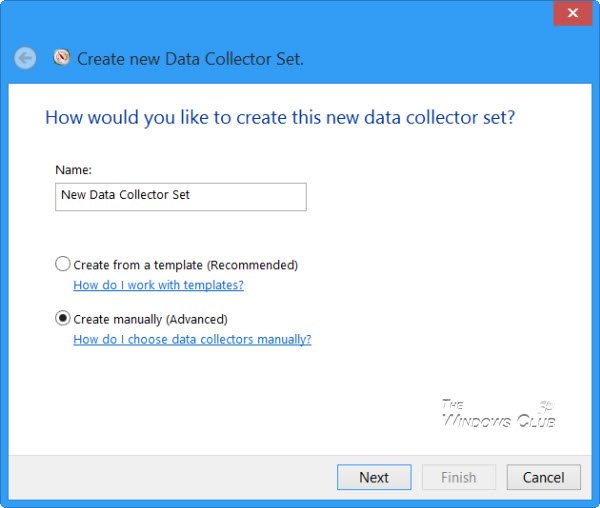
Give it a name and select Create manually (Advanced) to be able to set the parameters on your own.
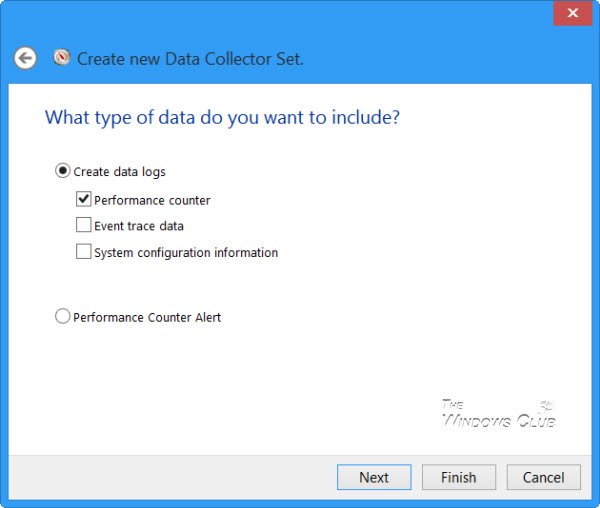
Select the type of data you want to include. Click Next.
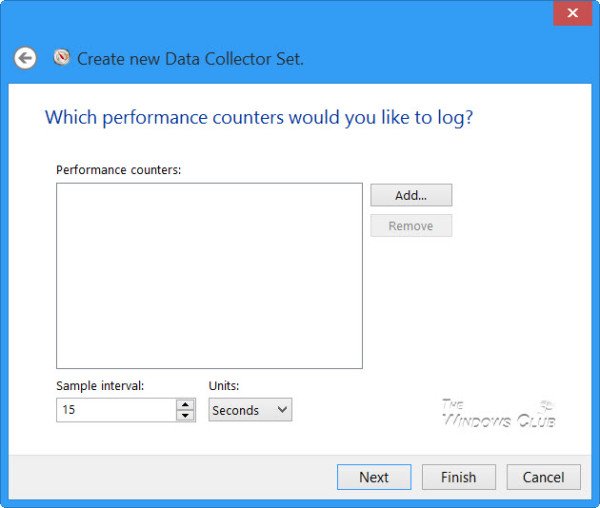
Click on Add and select the performance counters you would like to log. They could typically be a memory, processor usage, etc.
Once the selection is complete, click OK.
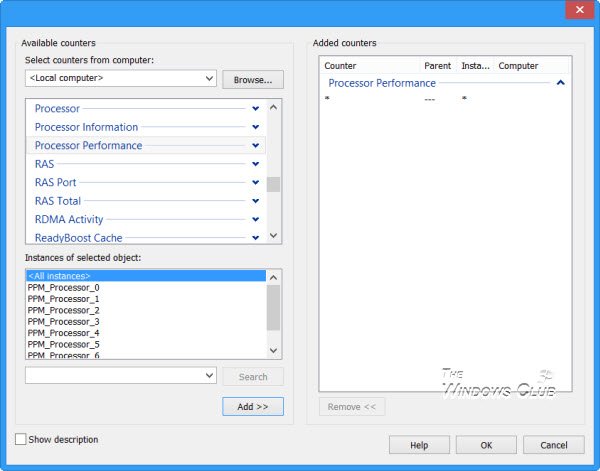
Select the Sample interval and the Units and click Next.

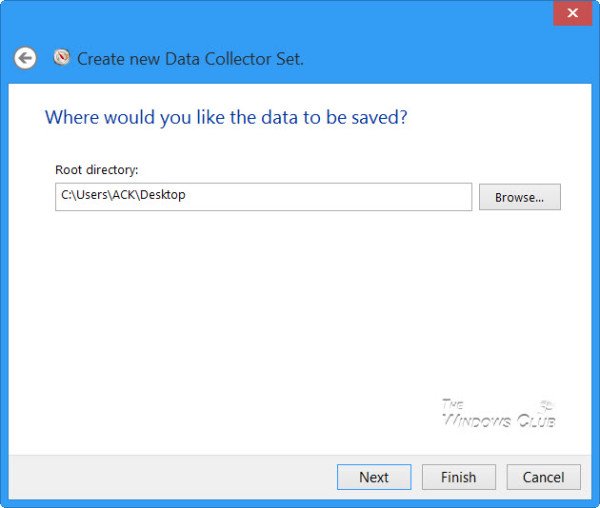
Now select the location you want to save the data.
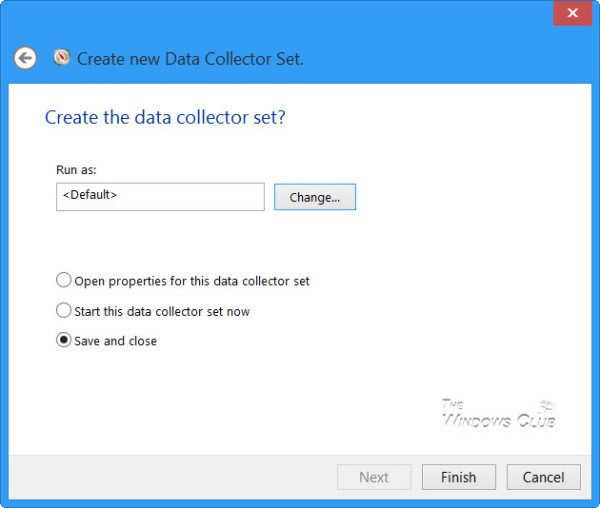
How would you like to run the task? Leave it at Default – or use the Change button to select some other user. Click Finish.
You will see the new entry in the right pane. Right-click on it and select Start.
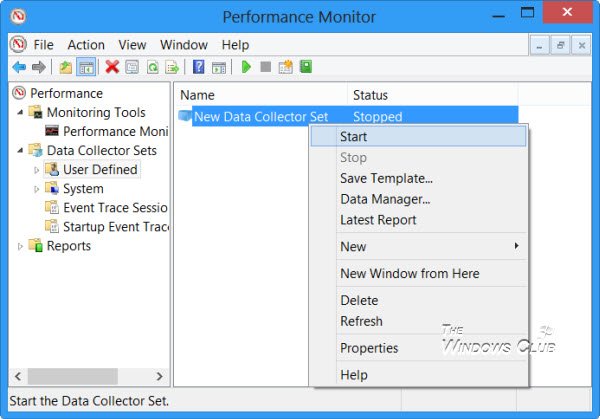
Once you are done, right-click on it again and select Stop.
The data log file will be created and save in the specified location. Click on the file to view it in the Performance Monitor.
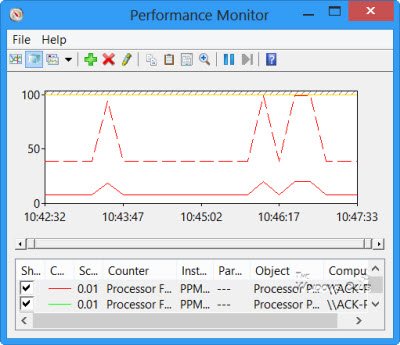
You will now be able to analyze the data for each of the counters.
While the task is running, you can always edit its properties by right-clicking on the Data Collector set in the left pane and selecting Properties.
Related: What is PerfLogs folder in Windows 11/10.
Some useful shortcuts for running Reliability Monitor and Standalone Performance Monitor, you can use via Run:
- perfmon /rel : Runs Reliability Monitor
- permon /sys : Runs a Standalone Performance Monitor
In our next post, we will see how to generate a System Health Report for your Windows computer.
How do I fix Performance Monitor (perfmon.exe) high CPU usage?
To fix Performance Monitor (perfmon.exe) high CPU usage in Windows, you will have to Repair system files and Update your drivers.
TIP: How to use Windows Reliability Monitor and the Resource Monitor may also interest you.